Project 1:Customer Segmentation with RFM Analysis Using K-Means
Project Goal:
Segment customers in order to target customers efficiently. 協助公司了解客戶樣貌,找出目標客群,進行分眾行銷分析。
Dataset Overview:
This is a transnational data set which contains all the transactions occurring between 2010/12/01 and 2011/12/09 for a UK-based and registered non-store online retail. The company mainly sells unique all-occasion gifts. Many customers of the company are wholesalers. Data Source: UCI Machine Learning Repository
Tools: Python, Power BI
Analysis Process:
1. Load Data2. Data Cleansing
3. Explore Data & Cohort Analysis
4. RFM Analysis
5. K-Means Clustering
6. Conclusion
🔗 Check out Full Code here.
1. Load Data
a. Import Libraries
# Import Libraries for Dataframe and Visualization
import numpy as np
import pandas as pd
import datetime as dt

import matplotlib.pyplot as plt
import seaborn as sns

# Import Libraries for Machine Learning Algorithm
import sklearn
from sklearn.preprocessing import StandardScaler
from sklearn.cluster import KMeans

import warnings
warnings.simplefilter(action='ignore', category=FutureWarning)
b. Load Data
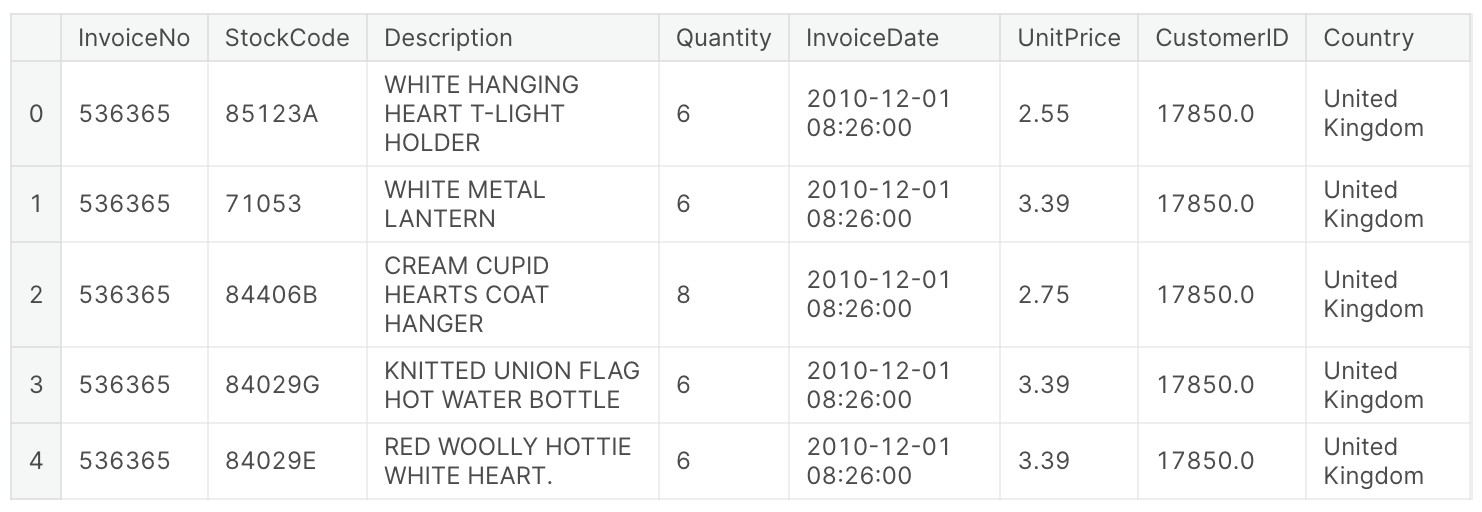
There are 8 columns and 541909 rows.
df = pd.read_excel('Online Retail.xlsx')
df.head()
2. Data Cleansing
a. Check and Drop Missing Values
b. Check and Drop Duplicates
c. Check and Change Data Types
The data type of ‘CustomerID’ should be object type.
df.dtypes
df['CustomerID'] = df['CustomerID'].astype('int').astype('str')
d. Exclude Noisy Data
Remove negative and 0 values in ‘Quantity’ and ‘UnitPrice’ columns.
df.describe()
df = df[(df['Quantity'] > 0) & (df['UnitPrice'] > 0)]
3. Explore Data & Cohort Analysis
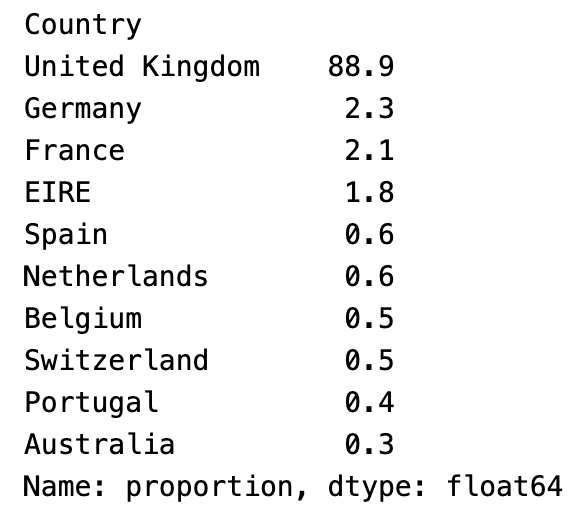
Top 10 Countries
df['Country'].value_counts(normalize = True).head(10).mul(100).round(1)
Monthly Transaction and Transaction Amount 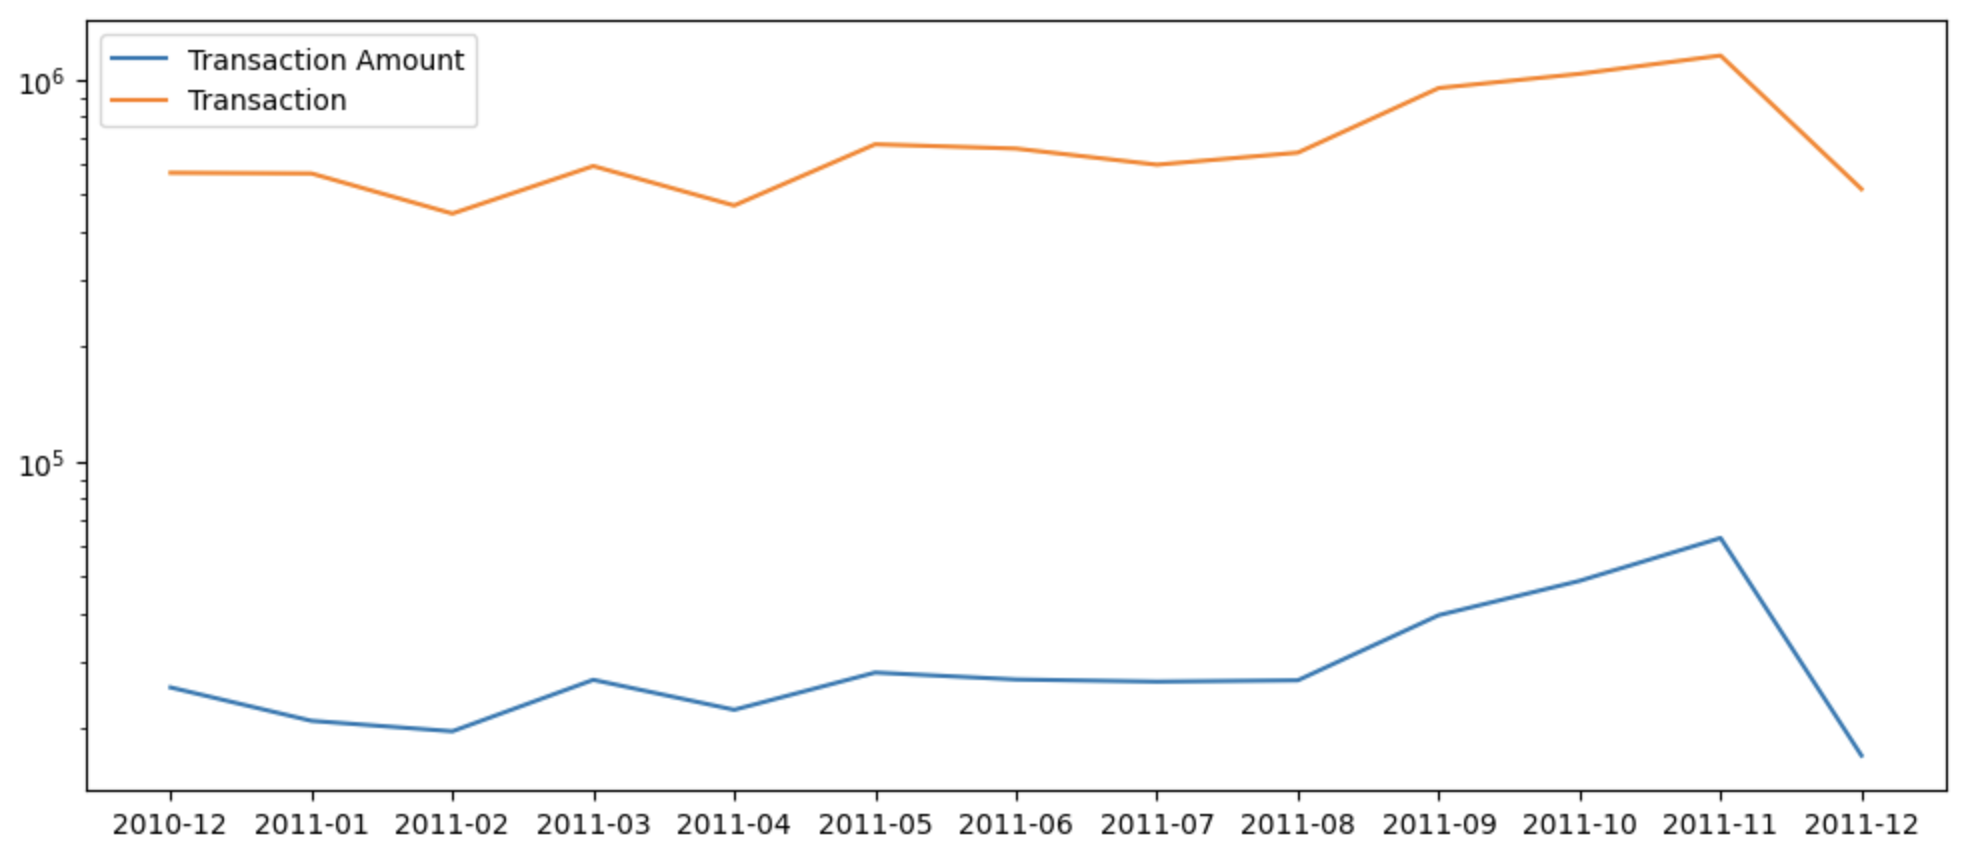
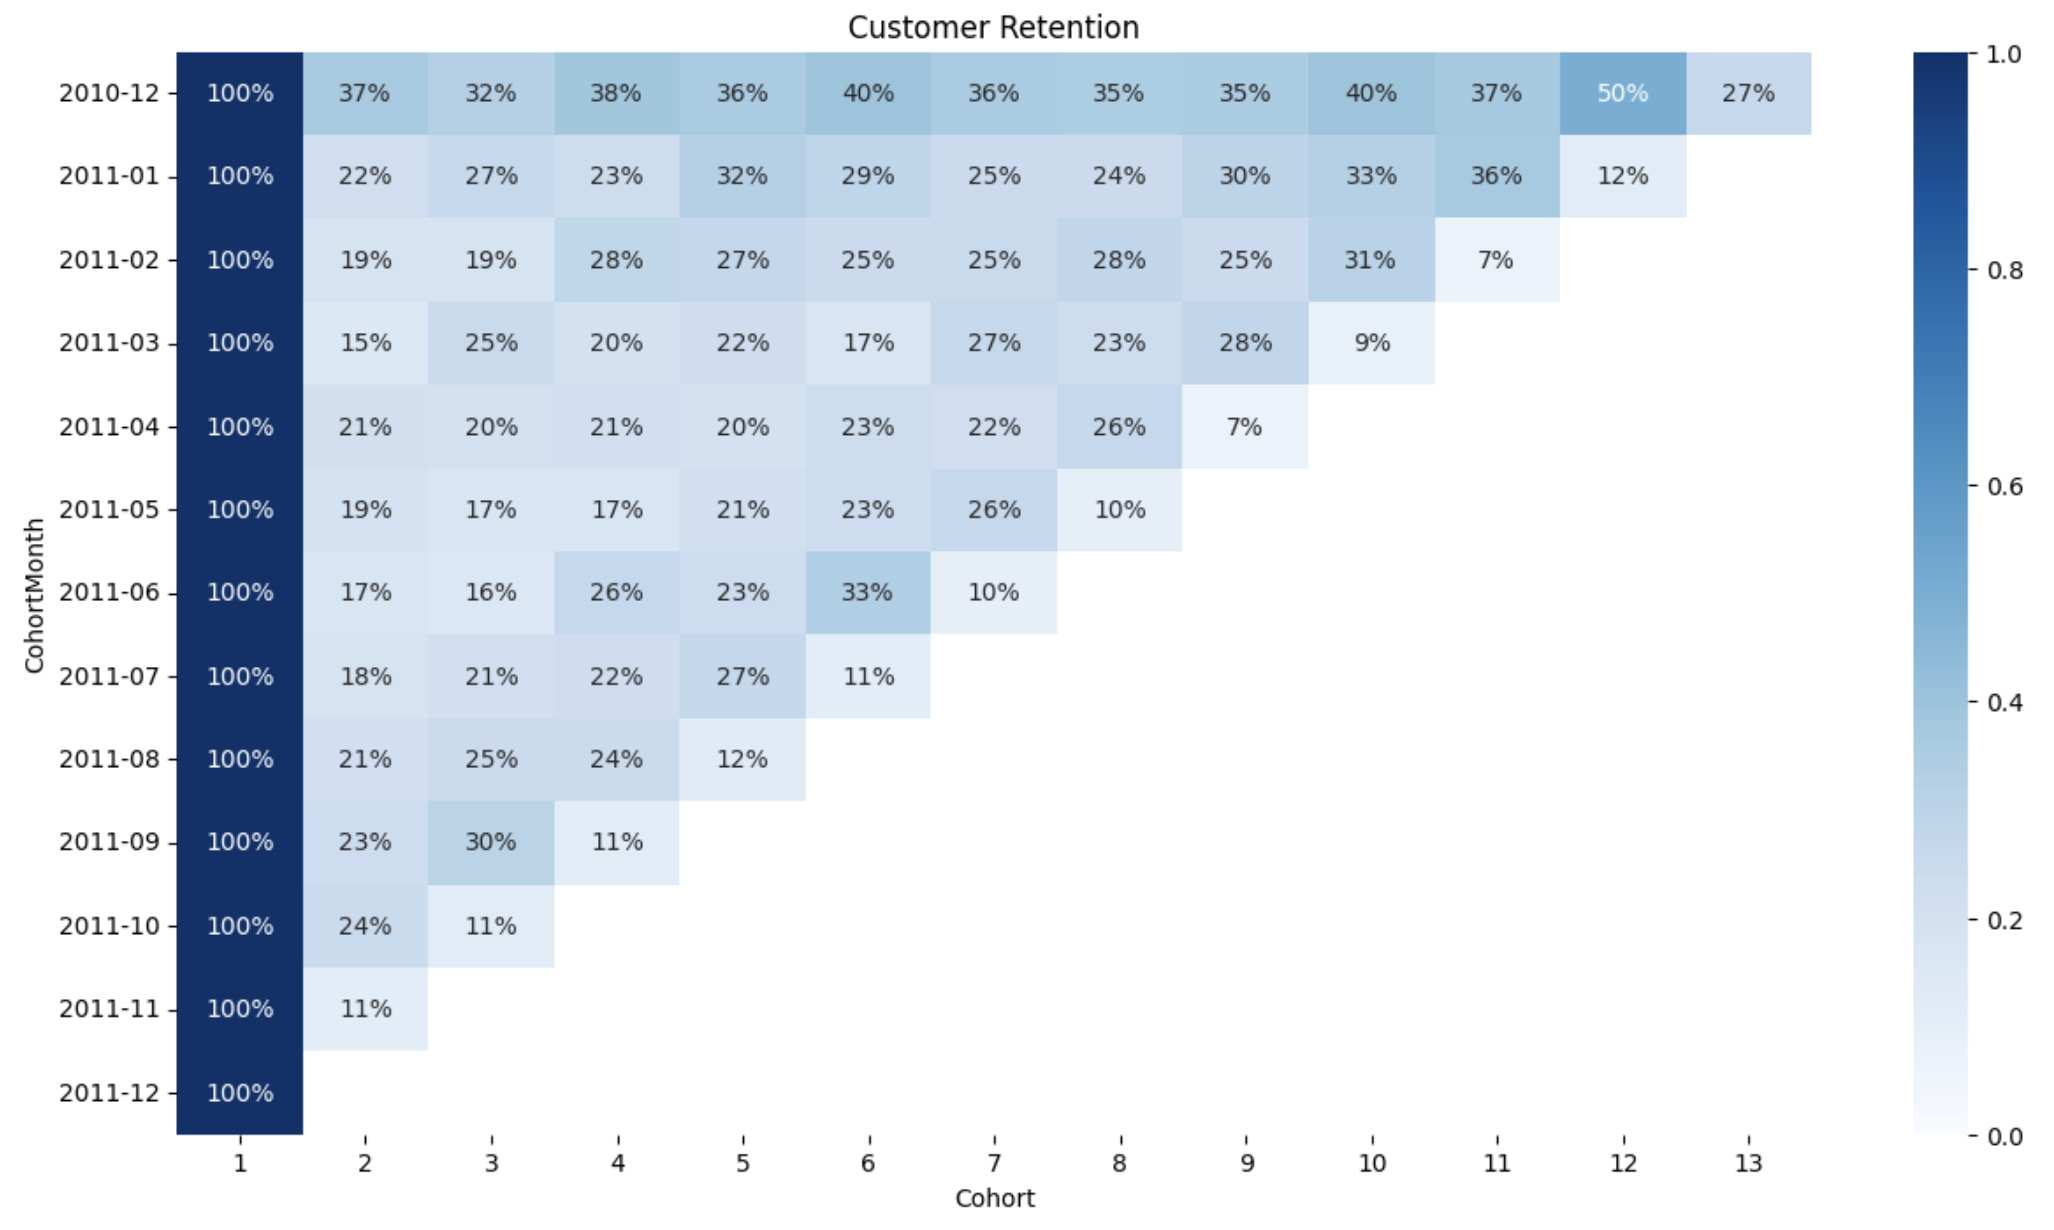
Corhort Analysis
4. RFM Analysis
a. Calculate RFM Metrics
RFM represents Recency, Frequency and Monetary.
RFM is a model used to segment customers base by their purchasing patterns.
F (Frequency) : How often each customer make purchases.
M (Monetary) : Total amount of money each customer spends.
b. Detect and Remove Extreme Outliers using the IQR Method
c. RFM Score
Rank each customer in these three categories on a scale of 1 to 4 (higher number, better result).
r_labels = range(4, 0, -1)
f_labels = range(1, 5)
m_labels = range(1, 5)

r_quartiles = pd.qcut(rfm['Recency'], q = 4, labels = r_labels)
f_quartiles = pd.qcut(rfm['Frequency'], q = 4, labels = f_labels)
m_quartiles = pd.qcut(rfm['Monetary'], q = 4, labels = m_labels)

rfm = rfm.assign(R = r_quartiles,
                 F = f_quartiles,
                 M = m_quartiles)

def rfm_seg(x):
    return str(x['R']) + str(x['F']) + str(x['M'])

rfm['RFM'] = rfm.apply(rfm_seg, axis = 1)
rfm['RFM_Score'] = rfm[['R', 'F', 'M']].sum(axis = 1)
rfm.reset_index(inplace = True)
rfm.tail()

5. K-Means Clustering
a. Data Preprocessing: Data Scaling & Standardization
# Undkew data with log scale
rfm_log = rfm[['Recency', 'Frequency', 'Monetary']].apply(np.log, axis = 1).round(3)

# Standardization
scaler = StandardScaler()
rfm_standard = scaler.fit_transform(rfm_log)
rfm_standard = pd.DataFrame(rfm_standard)
rfm_standard.columns = ['Recency', 'Frequency', 'Monetary']
rfm_standard.head()
b. Find the Optimal Number of Clusters Using Elbow Method and Silhouette Coefficient
# Elbow Method
wcss =[]
range_k = range(1, 11)

for k in range_k:
    kmeans = KMeans(n_clusters = k, random_state = 46)
    kmeans.fit(rfm_standard)
    wcss.append(kmeans.inertia_)

# Silhouette Coefficient
from sklearn.metrics import silhouette_score
range_k = range(2, 11)
silhouette_avg = []

for k in range_k:
    kmeans = KMeans(n_clusters = k, init='k-means++', random_state = 1)
    kmeans.fit(rfm_standard)
    cluster_labels = kmeans.labels_
    silhouette_avg.append(silhouette_score(rfm_standard, cluster_labels))
c. K-Means Clustering
# Choose K=4
kmeans = KMeans(n_clusters=4, random_state=46)
kmeans.fit(rfm_standard)

cluster_labels = kmeans.labels_
rfm_k4= rfm.assign(K_Cluster = cluster_labels)

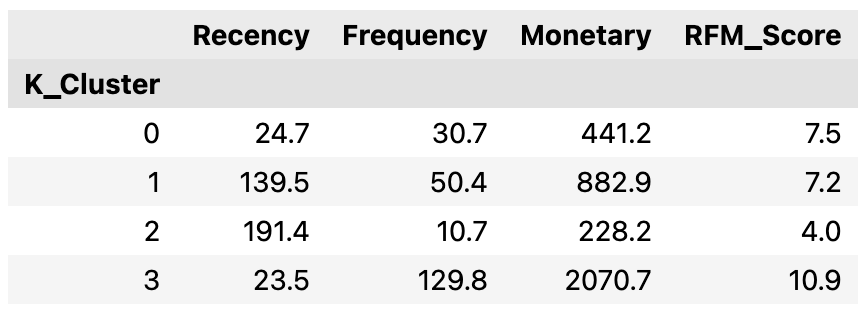
rfm_k4.groupby('K_Cluster').agg({'Recency':'mean',
                                 'Frequency':'mean',
                                 'Monetary':'mean',
                                 'RFM_Score':'mean'}).round(1)
rfm_melt = pd.melt(rfm_standard,
                   id_vars = ['CustomerID', 'Cluster'],
                   value_vars = ['Recency', 'Frequency', 'Monetary'],
                   var_name = 'Metric',
                   value_name = 'Value')

f, ax = plt.subplots(figsize = (8,6))
sns.lineplot(x = 'Metric', y = 'Value', hue = 'K_Cluster', data = rfm_melt, palette = "Set2")
plt.style.use('ggplot')
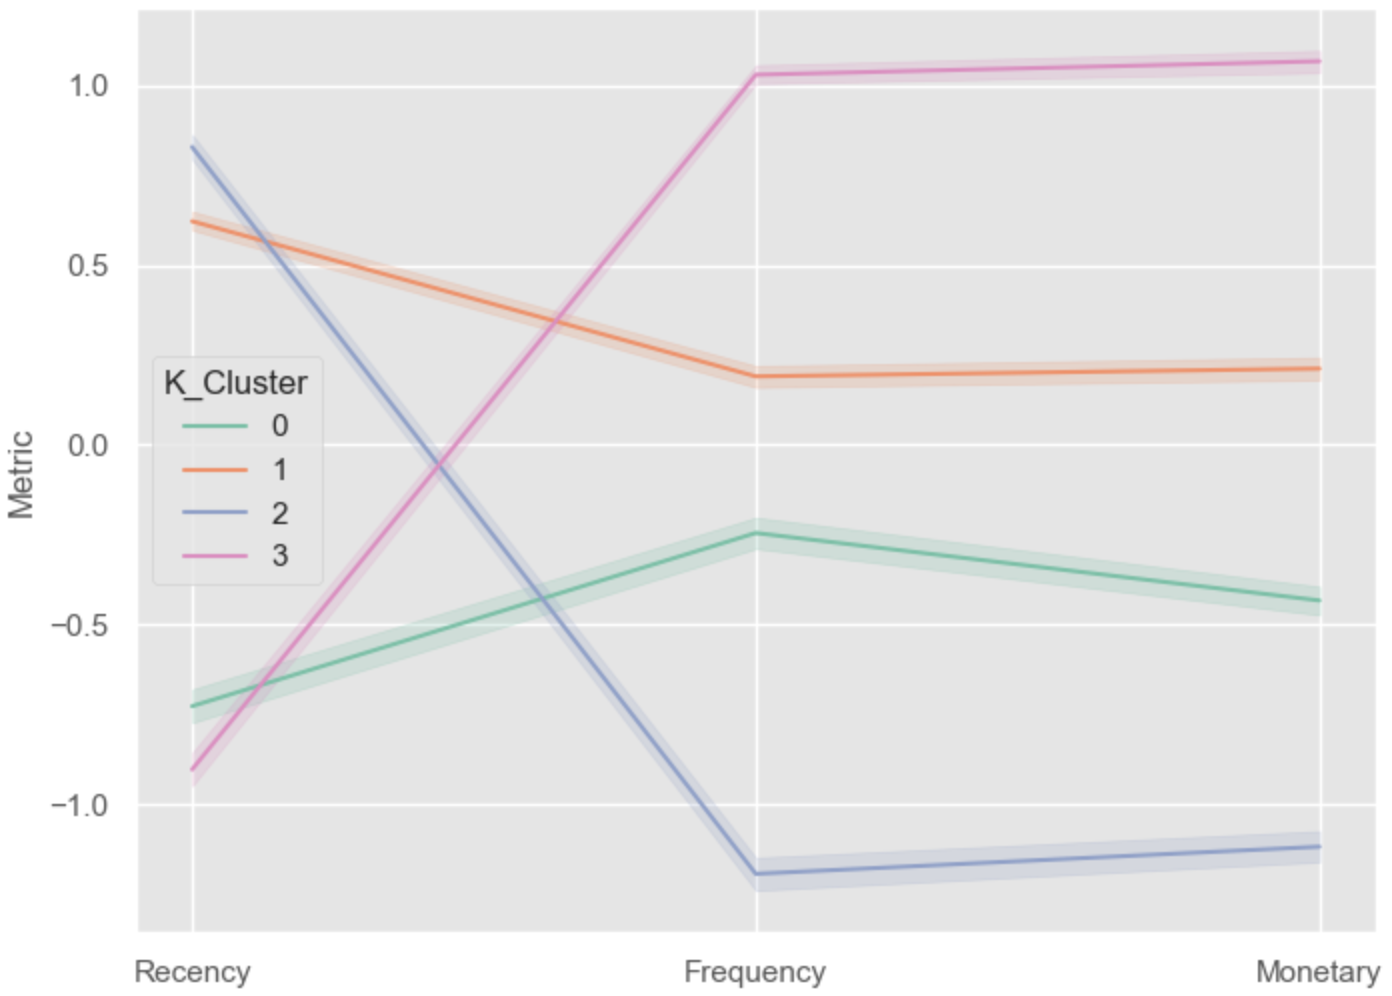
plt.title('Snake Plot of RFM')
plt.xlabel('Value')
plt.ylabel('Metric')
plt.show()
6. Conclusion
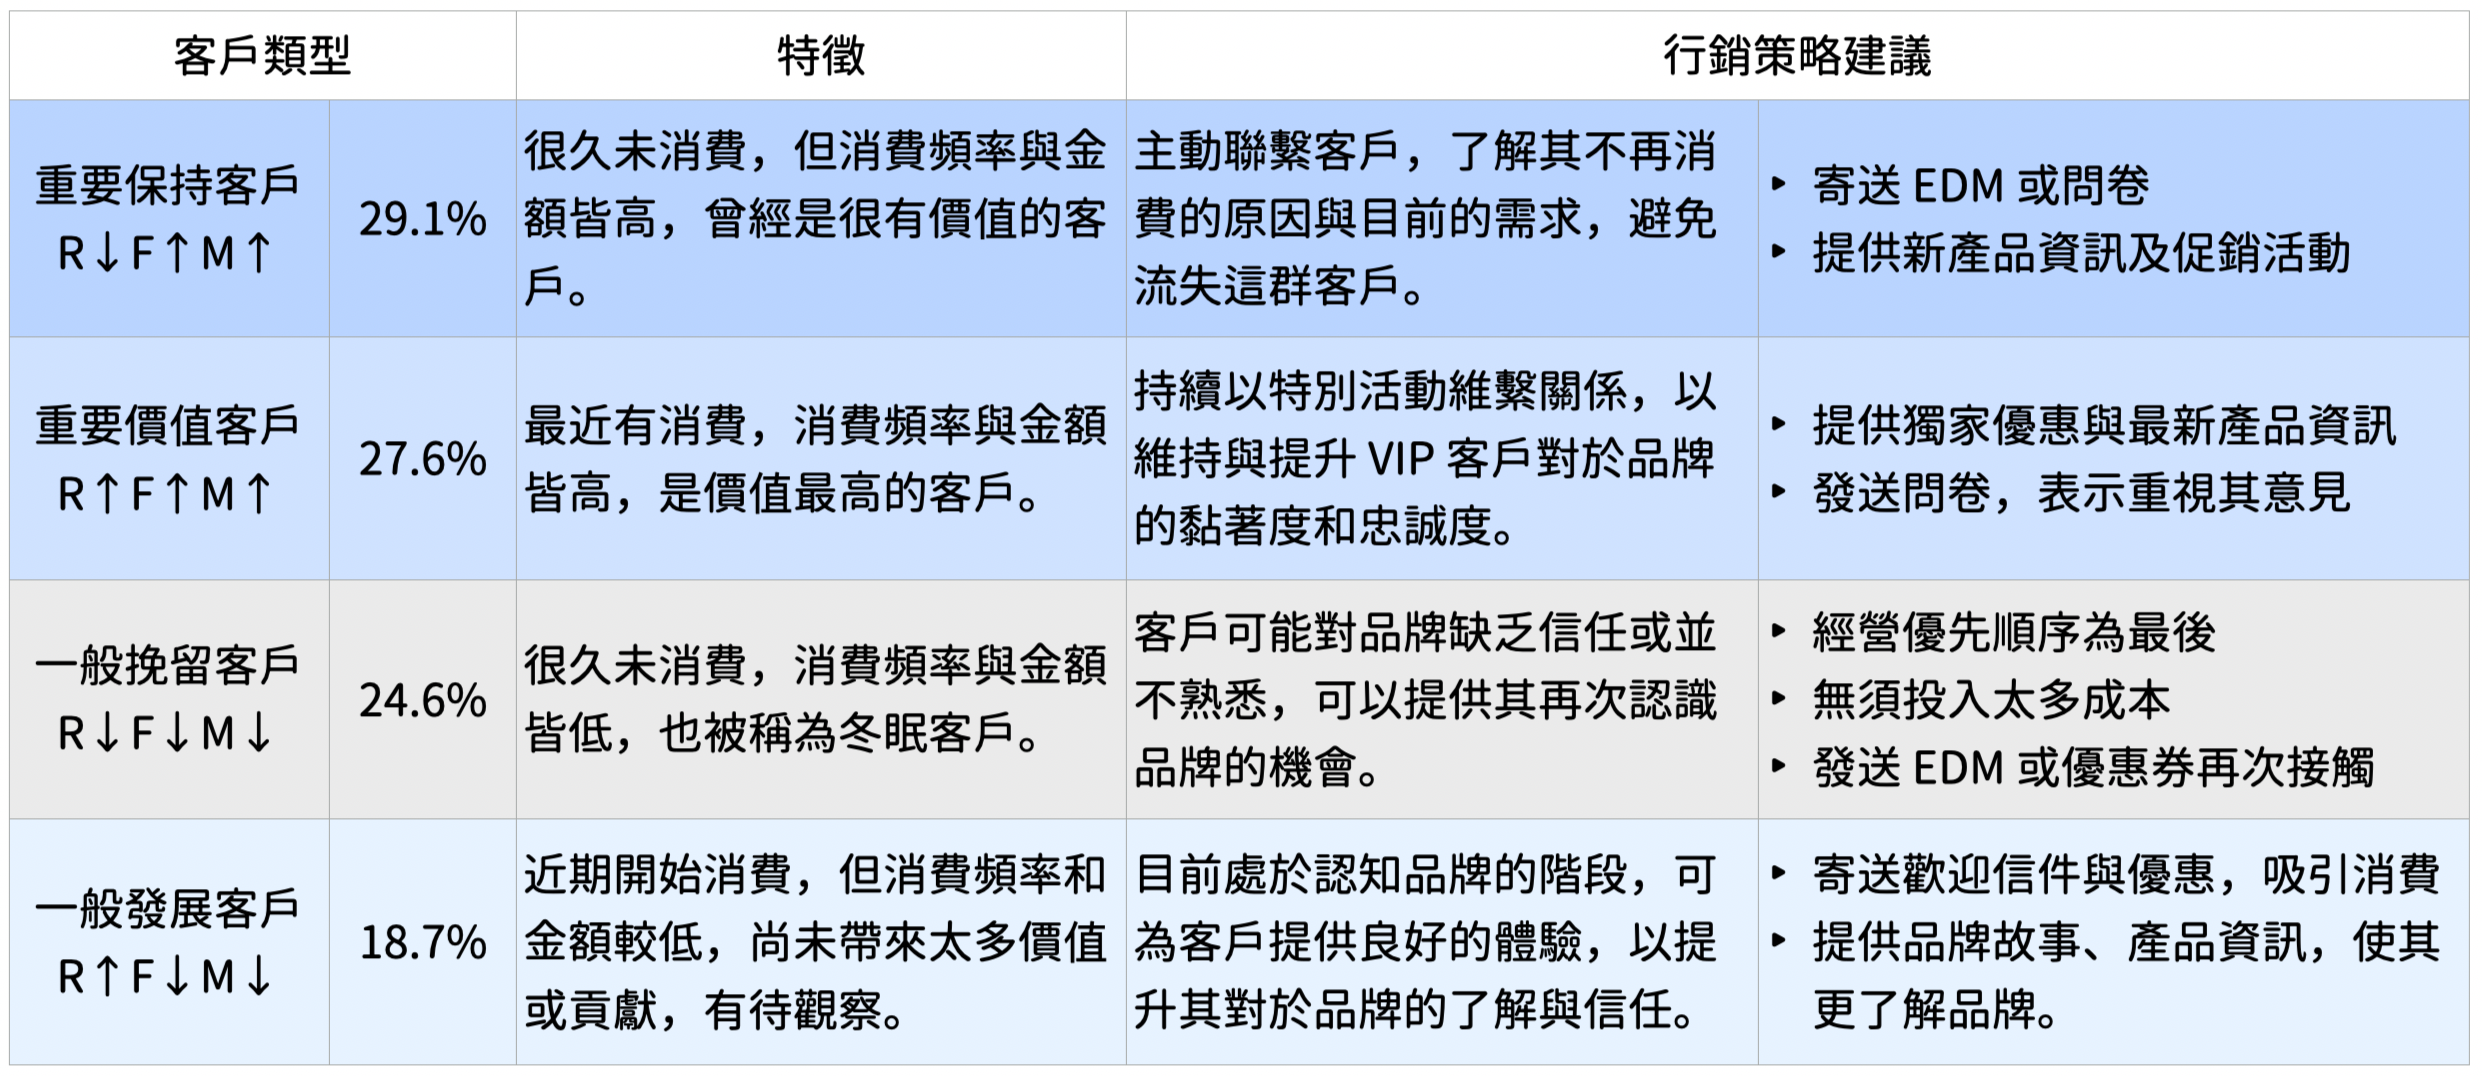
1. 數據顯示,2011年上半年客戶留存率平均比下半年高,建議了解上下半年度行銷策略上是否有變動。2. 根據11月的交易數量與金額,以及交易數量前十大產品顯示,聖誕節慶前的11月為創造最大收益的時機。
3. 根據 KMeans 之分群結果,客戶類型與行銷策略建議如下:
